Ad
Join Binance today and start trading!
One of the world’s largest crypto platforms, offering low fees and a wide selection of coins to trade.
BTC Live Price (USDT)
Day 6 – Indicators: Tools, Traps, and the Art of Not Overcomplicating Everything
By now, you know how to open trades and protect yourself.
Today, we’re diving into what every beginner loves — indicators.
They look cool, they sound smart, and they can destroy your focus if you use too many.
Let’s learn to use them like a pro — not like a Christmas tree decorator.
What Are Indicators, Really?
Indicators are just math formulas that process past prices to show you patterns and probabilities.
They don’t predict the future — they just help you see what’s already happening more clearly.
Think of them like glasses for your chart: they help you focus, but they won’t make you smarter if you don’t understand what you’re looking at.
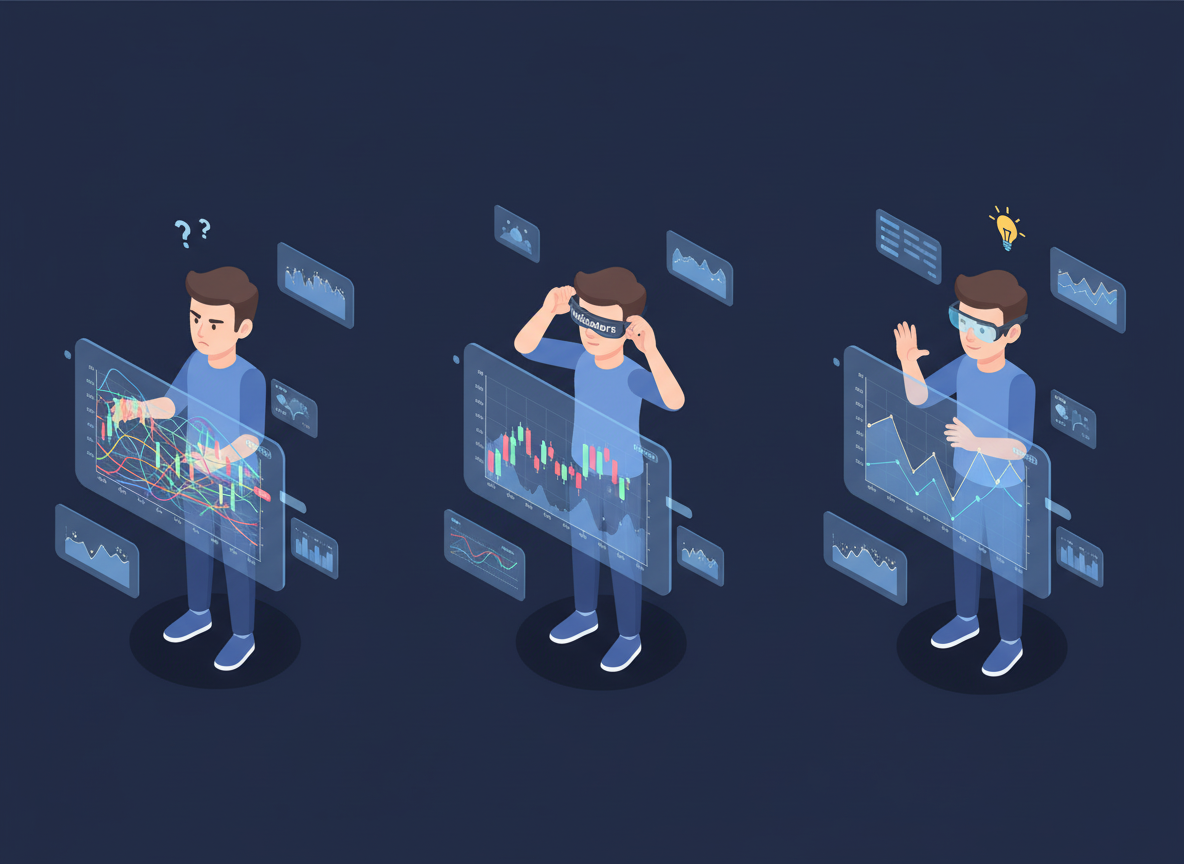
The Golden Rule: Less Is More
You only need 2 or 3 solid indicators that you truly understand.
The rest? Background noise.
The goal is to make decisions, not a Picasso.
The Main Indicator Families
Let’s break down the key ones every trader should at least know by name.
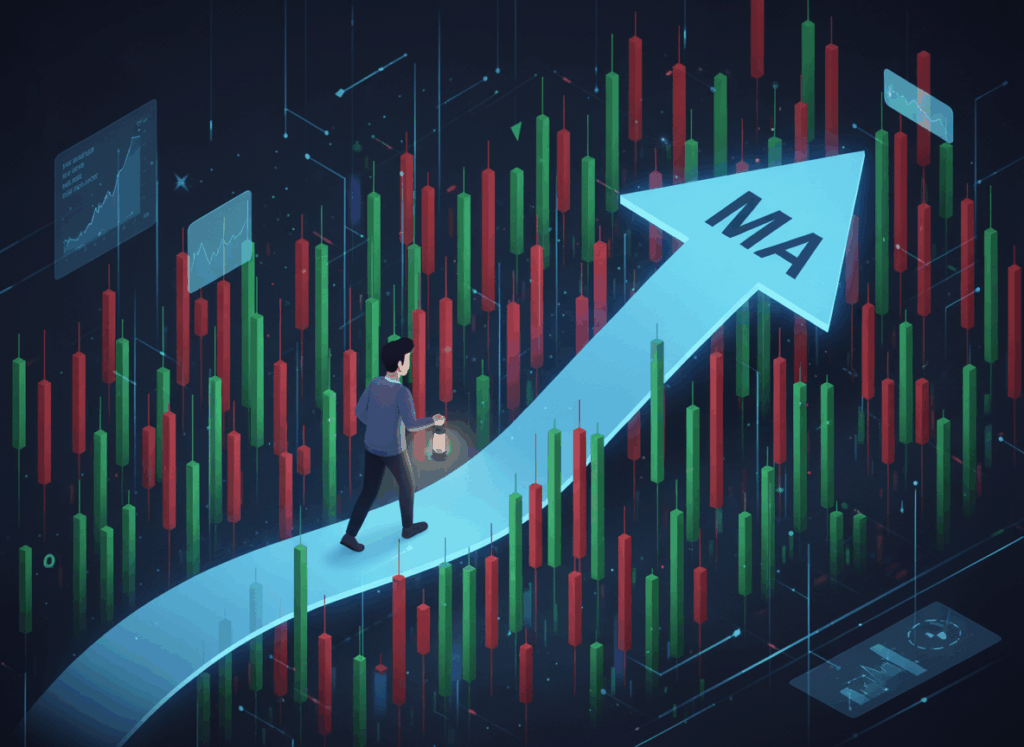
1. Trend Indicators
They show you where the market is heading.
- Moving Average (MA): smooths out price data to show the general direction.
- Above MA = uptrend
- Below MA = downtrend
- Above MA = uptrend
- MACD: shows the strength and momentum of a trend.
- Crosses up = possible buy
- Crosses down = possible sell
- Crosses up = possible buy
2. Momentum Indicators
They measure speed — how strong a move is.
- RSI (Relative Strength Index): tells if an asset is overbought (>70) or oversold (<30).
- Stochastic: similar to RSI but reacts faster.
Be careful — overbought doesn’t always mean “time to sell.”
Sometimes a strong asset just keeps running.
3. Volatility Indicators
They show how wild the market is moving.
- Bollinger Bands: think of them as rubber bands around price.
- When bands widen = volatility rising
- When they squeeze = big move coming soon
- When bands widen = volatility rising
- ATR (Average True Range): shows average price movement size — useful for setting stop-losses.
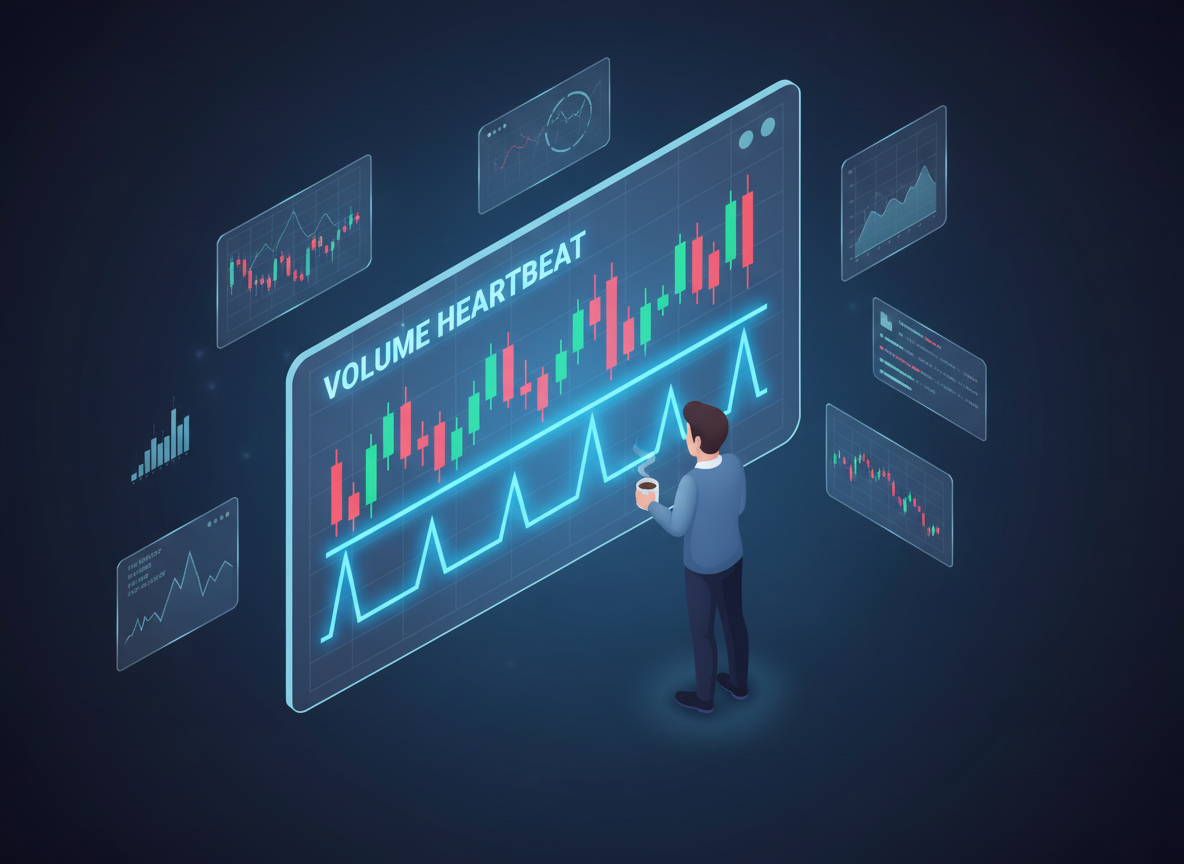
4. Volume Indicators
Volume = how much activity is happening.
It’s like the heartbeat of the market.
- Volume Bars: show how much is being traded.
- OBV (On Balance Volume): tracks whether money is flowing in or out.
If price goes up but volume goes down → something’s fishy.
How Pros Actually Use Them
- Pick one main indicator (for direction).
- Use a second for confirmation (momentum or volume).
- Ignore everything else.
Example combo:
→ Moving Average + RSI + Volume = simple, clear, effective.
The Trap: Indicator Addiction
If you keep adding more indicators, you’ll eventually get this:
- One says “buy.”
- One says “sell.”
- One says “take a nap.”
That’s called analysis paralysis — and it kills good trades.
Remember: indicators should simplify, not confuse.

Your Mission Today
- Open your demo chart.
- Try adding:
- Moving Average
- RSI
- Bollinger Bands
- Moving Average
- Watch how they react when price trends or consolidates.
Then, ask yourself: Do I actually understand what I’m seeing?
If not, drop one and focus on learning the others properly.
Next: The Trader’s Mindset