Ad
Join Binance today and start trading!
One of the world’s largest crypto platforms, offering low fees and a wide selection of coins to trade.
BTC Live Price (USDT)
Day 3 – How to Read Charts Without Having a Meltdown
Congrats, you’ve made it to the part where people usually start drawing lines all over the place and calling themselves “analysts.”
But don’t worry — today you’ll learn what charts really show, how to read them like a pro (or at least look like one), and why indicators are tools, not magic spells.
What’s a Chart, Really?
A trading chart is just a visual story of price movement — buyers vs. sellers, greed vs. fear, all squished into colorful candles.
Each candle tells you:
- Open: where price started
- Close: where it ended
- High/Low: how crazy it got in between
Zoom out, and you’re watching a war of emotions play out over time.
Trends: The Market’s Mood Swings
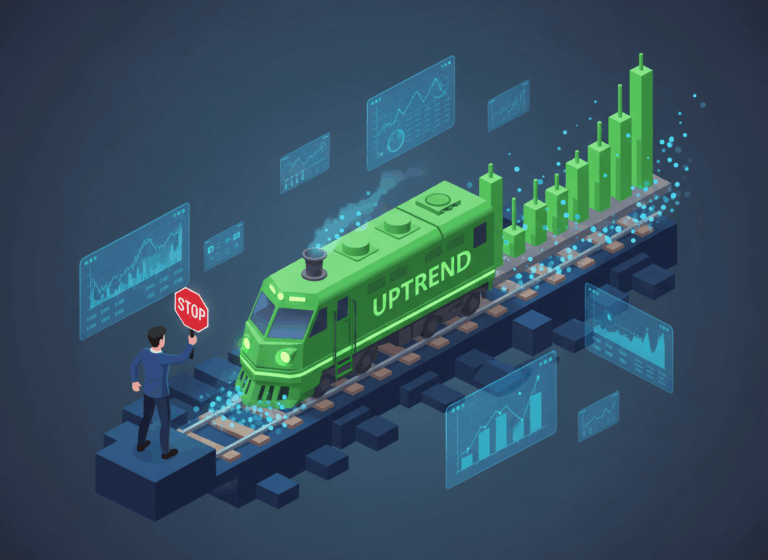
If you only remember one rule: trade with the trend — not against it.
- Uptrend = higher highs, higher lows. (Buyers in control.)
- Downtrend = lower highs, lower lows. (Sellers in control.)
- Sideways = everyone’s confused — grab a coffee, not a trade.
Trying to fight a trend is like standing in front of a train because you think it’s “due to stop.” Spoiler: it’s not.
Support and Resistance: The Market’s Invisible Walls
- Support = a price level where buyers often step in.
Think of it as the “floor” that catches falling prices. - Resistance = where sellers usually appear.
Like a “ceiling” that keeps price from flying higher.
When price breaks a strong level, it often flips sides — support becomes resistance and vice versa. Classic market mood swings.
Indicators: The Tools, Not the Oracles
Indicators are like road signs — helpful, but not perfect.
Here are the most common ones worth knowing (and what they actually tell you):
- RSI (Relative Strength Index) – Shows if the market is overbought or oversold.
Above 70 = maybe overheated. Below 30 = maybe oversold. - MACD – Compares two moving averages. Tells you if momentum is shifting up or down.
- Moving Averages (MA) – Smooth out price action to show the overall trend.
But here’s the key: indicators confirm ideas; they don’t predict the future.
If trading was just following RSI, everyone would be rich — and you wouldn’t be reading this.

How Pros Use Charts (and You Should Too)
- Start simple. Keep only what you understand.
- Zoom out. The bigger picture matters more than the last 5 candles.
- Wait for confirmation. Don’t trade just because a line crossed another line.
- Use charts to plan, not to pray.
Remember: charts don’t tell you what will happen — they show you what has happened, and how humans reacted.
Your Mission Today
- Open your exchange and explore the chart interface.
- Switch timeframes (1m, 1h, 1d) to see how the story changes.
- Add RSI and Moving Averages — observe how they move with price.
Don’t try to trade yet. Just learn the rhythm of the market.
Tomorrow, we’ll look at fundamental analysis — the real-world events that shake up those nice clean charts you just learned to read.
Next: A Crash Course in Fundamentals